
Playwright Trace Viewer is an interactive tool for investigating a recorded Playwright test. It puts the error, test actions, time-travel DOM snapshots, screenshots, actionability logs, network activity, console messages, source locations, metadata, and attachments on one timeline.
That correlation is what makes a trace more useful than adding another sleep or rerunning a failed CI job until it passes. A trace will not announce the root cause for you, but it can show whether the first useful lead is a locator, blocked element, frontend exception, failed request, wrong test data, or environment difference.
What does Playwright Trace Viewer record?
A trace is evidence captured while the test runs; Trace Viewer is the interface used to examine that evidence afterward. Depending on your configuration, the viewer can include:
- the ordered Playwright actions and their duration;
- the locator and API call behind an action;
- Playwright’s waiting and actionability log;
- Before, Action, and After DOM snapshots;
- a screenshot filmstrip;
- browser console output and test-side messages;
- browser network requests and available response details;
- the test source line associated with an action;
- errors, run metadata, and reporter attachments.
This is not the same as complete application observability. The network panel represents browser-side traffic captured in the trace; it cannot replace service logs, database telemetry, queues, or distributed tracing. Similarly, a DOM snapshot is inspectable historical evidence—not a live page whose JavaScript continues to execute.
Trace Viewer vs screenshots, video, Inspector, and logs
| Tool or artifact | Best question it answers | Main limitation |
|---|---|---|
| Trace Viewer | What action ran, what state surrounded it, and what other evidence correlates? | Must be recorded; still requires human diagnosis |
| Screenshot | What was visibly rendered at one moment? | No action, waiting, request, or source context |
| Video | What visible sequence did a user appear to experience? | Weak for locator, DOM, network, and code-level analysis |
| Playwright Inspector | What happens while I pause and step through a reproducible run? | Interactive and live; less suited to a completed remote CI failure |
| Console/job logs | What text did the application, test, and runner emit? | Often missing the browser state and time-correlated action |
Playwright’s best-practices guidance recommends rich trace evidence for CI failures instead of relying only on screenshots and videos. Keep the smaller artifacts when they serve a purpose, but use the trace as the investigation hub.
Choose the right Playwright trace mode
Configure tracing in playwright.config.ts. The current Playwright Test recording options provide several modes with different evidence and storage tradeoffs:
| Mode | What is recorded | What is kept | Typical use |
|---|---|---|---|
off |
No test traces | Nothing | When trace evidence is intentionally disabled |
on |
Every test | Every trace | Short, targeted diagnostic runs |
retain-on-failure |
Every test | Failed-test traces | Capture the failing first attempt while discarding passes |
retain-on-first-failure |
Tests until a file’s first failure | That first failure | Limit retained evidence per file |
retain-on-failure-and-retries |
Tests and retries | Failure and retry traces | Compare failed attempts with retry behavior |
on-first-retry |
The first retry only | That retry trace | Common CI balance recommended by Playwright |
on-all-retries |
Every retry | All retry traces | Investigate behavior across multiple retries |
The crucial detail: on-first-retry does not record the original first failure. If the retry passes, you have evidence from the flaky path’s successful retry, not a recording of the precise failed attempt. That can still be valuable, but do not mislabel it.
A practical CI baseline is:
// playwright.config.ts
import { defineConfig } from '@playwright/test';

export default defineConfig({
  retries: process.env.CI ? 1 : 0,
  use: {
    trace: process.env.CI ? 'on-first-retry' : 'retain-on-failure',
  },
});
If first-attempt failures are frequently unreproducible and policy permits the extra recording cost, test retain-on-failure or retain-on-failure-and-retries against your suite. Do not turn on every trace forever by habit: validate artifact size, run-time impact, access controls, and retention.
Control what the trace includes
The trace option also accepts an object. Current TestOptions documentation lists attachments, screenshots, DOM snapshots, and sources as enabled by default when tracing is active:
export default defineConfig({
  use: {
    trace: {
      mode: 'retain-on-failure',
      attachments: true,
      screenshots: true,
      snapshots: true,
      sources: true,
    },
  },
});
Disabling screenshots or snapshots can reduce evidence. Including sources makes a CI trace more self-contained but may expose proprietary test code. Choose deliberately instead of copying the most data-heavy settings into every repository.
How to record and open a Playwright trace
For a one-off local run, enable tracing from the command line:
npx playwright test tests/checkout.spec.ts --trace onUse this for a bounded diagnostic run rather than a normal full suite. After the run, open a trace archive directly:
npx playwright show-trace path/to/trace.zipIf you have the Playwright HTML report, open it and select the trace attached to the relevant test attempt:
npx playwright show-reportYou can also select or drag a trace into trace.playwright.dev. The official Trace Viewer guide states that a selected trace is loaded entirely in the browser and is not transmitted externally. That design does not make the contents non-sensitive: local screen sharing, downloaded files, browser policy, and the artifact’s original storage still matter.
The CLI can open a remote trace URL as well:
npx playwright show-trace https://artifacts.example.test/run-1842/trace.zipRemote access may be constrained by authentication, CORS, and organizational policy. Prefer a trusted local download when that gives clearer control over credentials and retention.
The first 60 seconds inside Trace Viewer
Do not click every panel at random. Use a fixed opening sequence:
- Verify identity. Confirm the test, browser project, attempt, retry status, duration, and environment. Investigating the wrong retry wastes more time than any panel saves.
- Read the error. Capture the exact assertion, timeout, strictness error, or exception without translating it into a theory yet.
- Select the failed action. Then move one meaningful state-changing action backward—often a click, navigation, form submission, or setup step.
- Compare Before, Action, and After. Check the route, target, overlay, loading state, data, accessible role/name, and visible response.
- Read the actionability log. Identify what Playwright waited for and whether the target was attached, visible, stable, enabled, and able to receive events.
- Correlate Network and Console. Look in the same time window for a failed/slow request, redirect, authorization problem, browser exception, or application warning.
At this point you should be able to state a falsifiable hypothesis: “the button was covered by the saving overlay after a slow response,” not merely “the click is flaky.”
Write that hypothesis in the incident or pull request before editing code. Include the trace attempt, the evidence that supports it, the evidence that would disprove it, and the next targeted run. This small habit prevents a team from converting one ambiguous failure into several unrelated timeout, retry, and selector changes that are difficult to review or reverse.
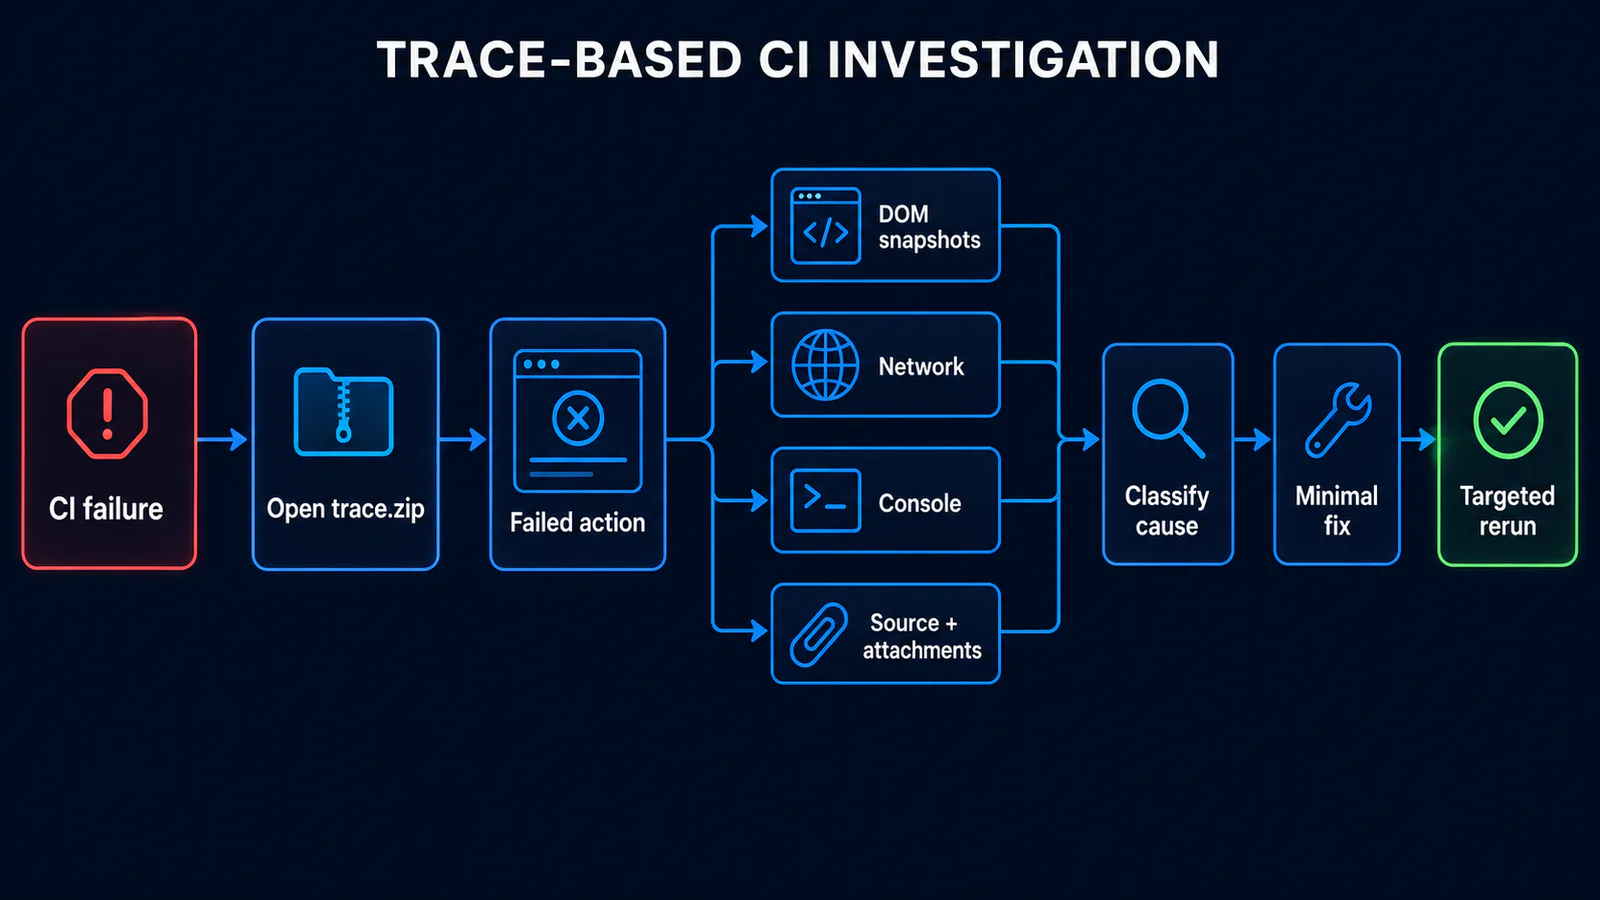
How to read every important evidence panel
Actions and timeline: establish sequence
The timeline and Actions panel show what Playwright attempted and how long it took. Selecting an action exposes its call, locator, source position, logs, and surrounding snapshots. Long duration is a clue, not a diagnosis: determine whether time was spent waiting for actionability, navigation, a response, or an assertion.
Start from the failure and work backward to the last action that could have changed state. A failed heading assertion may originate in an earlier request, a role switch, or a fixture that supplied the wrong tenant.
DOM snapshots: inspect historical page state
The Before, Action, and After tabs let you inspect the page around an action. Use them to answer:
- Was the test on the expected route?
- Did the locator match the intended accessible element?
- Was a dialog, cookie banner, spinner, or toast covering the target?
- Was the control disabled or duplicated?
- Did the UI already contain an error state before the assertion?
The snapshot is not the live application. Animations, timers, and arbitrary JavaScript should not be expected to replay. Use it as a preserved document state aligned to the action.
Call and Log: understand locator and actionability behavior
The Call panel shows the API invocation and locator details. The Log panel shows Playwright’s waiting behavior. Together they distinguish several common cases:
- A strictness error with two matches is a locator-contract problem. Review the role, accessible name, parent scope, and product semantics before reaching for
first(). - A target that remains covered suggests an overlay or readiness problem. Do not hide it with an arbitrary timeout.
- A control that remains disabled may be waiting for application data or validation, not a slower click.
- A detached element may indicate rerendering or a state transition that the test misunderstood.
For durable locator design, use the patterns in the Playwright locators guide rather than patching one trace with a brittle selector.
Network: connect a UI symptom to browser traffic
Filter and sort the Network panel by method, status, resource type, duration, or size. Inspect available request and response headers and content. Useful questions include:
- Did the expected request start after the action?
- Was it redirected, unauthorized, rate-limited, cancelled, slow, or a 5xx?
- Did the response correspond to the account, feature flag, or test data you expected?
- Did several similar requests race or complete in a surprising order?
Not every payload is guaranteed to be available, and a browser trace cannot tell you why a service returned a 500. Use the request identifier and timestamp to continue in the backend’s own logs and telemetry.
Console and errors: find application-side symptoms
The Console panel aligns browser messages with the test timeline and can be filtered around an action. A JavaScript exception immediately after navigation may explain why the expected control never appeared. A feature-flag warning or authorization message may point to environment setup.
Avoid logging secrets to make diagnosis easier. Trace and report viewers are not secret stores, and console output often flows into multiple artifacts.
Source and metadata: verify code and execution context
The Source panel highlights the test line for the selected action. Use it to verify that the CI artifact corresponds to the commit and helper path you think it does. Metadata such as browser, viewport, duration, and timing helps expose a one-project or environment-specific failure.
A source line is where the symptom surfaced, not necessarily where the defect began. Follow the evidence backward through setup and state-changing actions.
Attachments: add only evidence you will use
Attachments can preserve JSON, logs, screenshots, visual differences, identifiers, or other test-specific context. Playwright’s TestInfo API supports attaching a file or body for reporters:
test('submits an order', async ({ page }, testInfo) => {
  const orderId = await createOrder();

  await testInfo.attach('order-context.json', {
    body: JSON.stringify({ orderId, scenario: 'standard-checkout' }),
    contentType: 'application/json',
  });

  await page.goto(`/checkout/${orderId}`);
});
Attach the smallest redacted context that changes an investigation. Do not dump full databases, tokens, cookies, or customer records. Consistent names are more valuable than dozens of unlabeled files.
A trace-based CI failure investigation workflow
- Preserve the original evidence. Keep the failing job log, HTML report, trace, and relevant attachments before the CI retention window expires.
- Identify the exact attempt. Record test, project/browser, worker, attempt number, retry outcome, commit, and environment.
- Start at the reported failure. Read the error, then inspect the last state-changing action that could have caused it.
- Reconstruct page state. Compare DOM snapshots and screenshots. Verify route, account, tenant, locator target, loading state, and overlays.
- Correlate other evidence. Align actionability logs, network requests, console messages, source, and attachments in the same window.
- Classify the likely layer. Choose among locator contract, application state/timing, frontend, backend/network, test data/fixture, or CI environment.
- Make one minimal change. Run the failed test in the affected project. Preserve the new trace if the symptom changes or the hypothesis is rejected.
This workflow fits into a broader Playwright framework when trace policy, reporter output, test identifiers, fixtures, and CI artifact handling share one design.
Trace symptom-to-cause matrix
| Evidence in the trace | Investigate first | Avoid as the first response |
|---|---|---|
| Strictness error with multiple matching nodes | Accessible role/name and locator scope | Adding first() without understanding ambiguity |
| Element remains covered or disabled | Overlay, loading state, animation, readiness contract | Arbitrary sleep |
| Correct click followed by 401/403 | Session, role, storage state, and API response | Rewriting the click locator |
| Slow or 5xx request before missing UI | Service logs, test data, dependency health | Increasing only the assertion timeout |
| Console exception after navigation | Frontend code, bundle, flags, environment | Retrying until green |
| Wrong account, tenant, or record visible | Fixture isolation and seed-data ownership | Broad page-object refactor |
| Failure in one browser project only | Project configuration and browser-specific behavior | Disabling that project |
This matrix prioritizes the next investigation; it does not prove causation. Confirm a backend hypothesis with backend evidence and a fixture hypothesis with the owning setup path. The Playwright fixtures guide explains lifecycle, worker scope, retries, and cleanup when the evidence points to setup.
Preserve Playwright reports and traces in CI
A CI job must upload its report even when tests fail. For GitHub Actions, a bounded example is:
- name: Upload Playwright report
  if: always()
  uses: actions/upload-artifact@v5
  with:
    name: playwright-report
    path: playwright-report/
    retention-days: 14
The action version is current at the time of writing; verify it against official documentation before adopting the snippet later. Fourteen days is an example, not a universal policy. Choose the shortest retention that supports your incident and compliance needs.
Download and extract the report in a trusted environment, then run npx playwright show-report path/to/report. The official CI introduction warns that reports, traces, and logs can contain credentials, access tokens, source/application code, and other sensitive data.
Use an access-controlled artifact store, restrict public sharing, and encrypt artifacts when policy requires it. Redact at the source because deleting one trace does not remove copies already downloaded, cached, or forwarded.
Manual tracing with the Playwright library
If you use the Playwright library without Playwright Test, tracing is available from a BrowserContext:
const context = await browser.newContext();

await context.tracing.start({
  screenshots: true,
  snapshots: true,
  sources: true,
});

const page = await context.newPage();
await page.goto('https://example.test/checkout');
// Perform scenario actions.

await context.tracing.stop({ path: 'trace.zip' });
The Tracing API also supports chunks for dividing a long session. Its important limitation is that manual context.tracing records browser operations and network activity but not test assertions. For Playwright Test suites, prefer runner configuration so assertions, retries, reports, and attachments remain integrated.
Common Trace Viewer mistakes
- Assuming the last red line is the root cause. It may only be the first assertion that noticed earlier bad state.
- Calling a passing retry proof of a timing defect. It proves only that the retry passed under that attempt’s conditions.
- Adding waits before checking actionability and network evidence. This hides symptoms and slows the suite.
- Opening the wrong project or retry trace. Always verify metadata and attempt identity first.
- Treating DOM snapshots as a live app. They preserve inspectable historical state, not a fully executing page.
- Using manual tracing in a runner suite without recognizing the assertion gap. Prefer Playwright Test trace configuration.
- Uploading artifacts publicly. Traces can contain far more sensitive data than a failure screenshot.
- Collecting everything without a retention budget. Evidence that nobody can find, trust, or safely store is operational noise.
Can AI help analyze a Playwright trace?
AI can help organize already-redacted evidence. Give it the exact error, a small actionability-log excerpt, relevant console message, request status, project metadata, and what changed between attempts. Ask it for competing hypotheses and the next observation that would falsify each one.
Do not upload a raw trace containing tokens, cookies, customer data, private URLs, or source code to an unapproved service. Do not let an assistant silently replace a locator, increase a timeout, or declare correlation to be causation. The QA engineer remains responsible for validating the trace, consulting the owning system, and approving the smallest safe fix.
Playwright Trace Viewer investigation checklist
- Trace mode matches the evidence you think it records.
- The failing artifact is uploaded even when the CI step fails.
- Test, browser project, commit, environment, attempt, and retry are verified.
- The error and last state-changing action are inspected first.
- Before, Action, and After DOM evidence is compared.
- Actionability logs are correlated with network and console activity.
- The suspected layer is named before code is changed.
- The smallest fix is rerun in the affected project.
- Traces and reports are access-controlled, redacted, and retained deliberately.
Playwright Trace Viewer FAQs
How do I open a Playwright trace.zip file?
Run npx playwright show-trace path/to/trace.zip. You can also open the HTML report with npx playwright show-report and select the trace, or load a trusted local file in trace.playwright.dev.
Should I use trace: ‘on’ in CI?
Usually not for every test indefinitely. It records and keeps all traces, which can increase overhead and storage. Playwright recommends on-first-retry as a common CI setting; choose a retain mode when evidence from the original failed attempt is worth the additional recording cost.
Does on-first-retry capture the original failure?
No. It records the first retry. If that retry passes, inspect it as comparative flaky-path evidence, not as a recording of the original failed attempt.
Can Trace Viewer show network requests and console errors?
Yes. It correlates captured browser network activity and console messages with actions and time. Availability and detail can vary, and these panels do not replace backend or infrastructure telemetry.
Are Playwright traces safe to share?
Do not assume so. Traces and related reports may expose tokens, cookies, test data, internal URLs, console output, source code, screenshots, and request/response details. Redact, restrict access, and apply a deliberate retention policy.
Why is my assertion missing from a manually recorded trace?
The BrowserContext tracing API does not record test assertions. When using Playwright Test, configure tracing through the runner so assertion, retry, report, and attachment evidence stays integrated.
Debug from evidence, not retries
Playwright Trace Viewer is most effective when a team agrees on three things before the next failure: which attempts to record, how CI preserves and protects the artifact, and how engineers inspect evidence in a consistent order.
Start with the error and last state-changing action. Compare the DOM around it, read the actionability log, correlate network and console evidence, classify the likely layer, and change one thing. That discipline turns a trace from a large zip file into a reliable debugging workflow.
For the wider testing architecture around those decisions, continue with the Playwright automation guide, the Playwright TypeScript guide, and the real-world Playwright E2E workflow.